Hard Disk Sentinel Help - S.M.A.R.T.
On the S.M.A.R.T. (Self-Monitoring Analysis and Reporting Technology) page the list of S.M.A.R.T. attributes are displayed for the selected disk drive. Depending on the drive type, connection, different kind of attributes and different sections/values displayed. These provided by the hard disk (or SSD) to reflect the actual status. The list of the attributes defined by the manufacturer - so not all hard disks contain all attributes. The list is fixed, it is not possible to add or remove attributes after the hard disk left the factory. The set of attributes may vary on different hard disks of the same manufacturer but same type hard disks usually have same attribute lists (there may be exceptions, as firmware updates may add/change attributes).

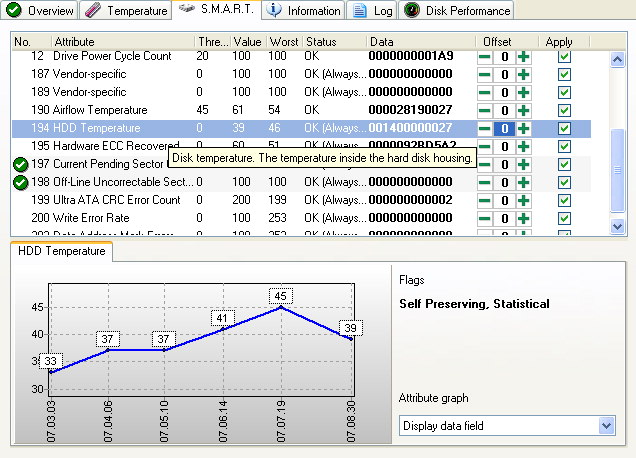
From left to right, the list begins with the identifier (number), it can be between 0 and 255. If the attribute directly affects hard disk health status and it can reach a critical level, Hard Disk Sentinel displays a green tick mark (attribute OK) or red X (attribute is not correct) before the number.
Then the name of the attribute is displayed - if it is not unknown. Most attributes are widely used by all (or almost all) manufacturers but the value and meaning of some attributes are unknown because the manufacturer does not release such information.
The Threshold column contains the threshold value for the attribute. If the Value column contains a number which is smaller than the threshold, the attribute is not correct. If the attribute is a critical one, the red X is displayed in this case at the start of this line. In the Worst column, the worst value ever measured is displayed.
In the Status column the current status of the attribute is displayed. It can be:
OK: the value is same or greater than the threshold. There is no problem.
OK (Always passing): the threshold is zero so it is not possible to have smaller value. Usually displayed for the attributes indicating only statistical information.
Fail: for a critical attribute the value exceeded the threshold (value is smaller than threshold).
Usage limit exceeded: for a non-critical attribute the value exceeded the threshold (value is smaller than threshold).
In the Data column the raw measured values are displayed. These values are not evaluated by the hard disk. In contrast, the Value column contains an evaluated number which depends on the manufacturer and the hard disk. These values are displayed in hexadecimal format. It is possible to select decimal values from the menu displayed after a right click on the S.M.A.R.T. table.
When examining the disk condition and calculating health value, it is recommended to check the raw values because this way it is possible to have an objective, manufacturer-independent status of the hard disks.
In the Offset column, it is possible to specify an offset value (positive or negative). Hard Disk Sentinel will add (subtract) this number for the attribute when evaluate it. This can be used for example during the temperature calibration procedure. There are many options to set the offset value:
By using - and + icons: the number decreases or increases by one.
By clicking on the number between the icons: the number can be specified directly in a small window.
If the correct attribute is selected, the + and - buttons and the ENTER can be used to specify the offset value.
Note: it is recommended to specify the offset directly by clicking on the number or by pressing ENTER.
The checkbox in the Enable column can be used to enable/disable the attribute. If an attribute is disabled, it does not count into the health and performance values. Changes (degradations) of disabled attributes will not be saved into the hard disk log. Because of these, disabling any attribute is NOT recommended.
Attention: by using the offsets and the Enable options, the hard disk status may be incorrectly or imprecisely displayed. Only advanced users should modify any of these options.
Note: changes of the offsets and Enable options will be saved only in the registered version. If the unregistered version is used, the changes in such options are automatically discarded when the application is re-started.
A text description (with the meaning and importance of the attribute) is displayed in as hint when the mouse is moved over an attribute. After a right click on the table, a pop up menu is displayed with option to keep this description visible for each attributes. The complete list of known S.M.A.R.T. attributes is described in the appendix.
By using the right mouse button, it is possible to copy the information displayed in the table to the clipboard. Later it is possible to paste this information into a text file, e-mail or document.
Attribute graph
Under the table, the graphical history of the currently selected S.M.A.R.T. attribute is displayed. On this graph it is possible to examine how the attribute changed. The two endpoints of the graph reflect the first measured value (installation day) and the most recent (current) value of the attribute. All other days between these two dates are selected automatically.
Next to the graph, the status flags of the attribute are displayed. All attributes may have one or more status flags. They indicate the main purpose of the attribute. These can be:
Critical: the value may decisively affect the health status of the hard disk (eg. number of sectors moved to spare area).
Statistical: the value does not affect directly or indirectly the status (eg. number of power cycles).
Performance: the value may affect performance or speed (eg. power on time, seek time).
Error-rate: usually correctable attributes where the value does not affect directly the health of the hard disk (eg. seek error rate).
Event count: counter value, increases when some events or problems occur (eg. new bad sector is found).
Self Preserving: the value of the attribute is under continuous monitoring.
Attribute graph views
It is possible to display two different kind of numbers. By default, the Display data field is selected, so the raw, manufacturer-independent numbers are displayed. The default mode can be selected on the advanced options configuration page. The differences between the methods are described here.
Display data field
These values increase in case of a problem because they actually contain the number of problems (for example, number of bad sectors) or events. The graph is ideal if the trend is stagnating.
Many attributes (for example, power on time, drive power cycle count, etc.) are always increasing. This will make the trend of the graph for these attributes to increase also, but it is completely normal. For some (especially statistical) attributes, the number can be very high and then it can fall, it is normal also. The graph is important for the critical attributes (for example reallocated, bad sector count) where the analysis of the previous values can reveal problematic days or period in the lifetime of the disk.
Display vendor specific values
By examining the number of the numbers in the "Value" column, it is possible to check the trend of the manufacturer-dependent values. These values decrease in case of a problem until they reach the threshold value for the attribute. If the attribute is critical and the threshold is reached, the disk has S.M.A.R.T. problem, at this point the hard disk should be immediately replaced. At this point, the manufacturers should replace the disk under the terms of warranty.

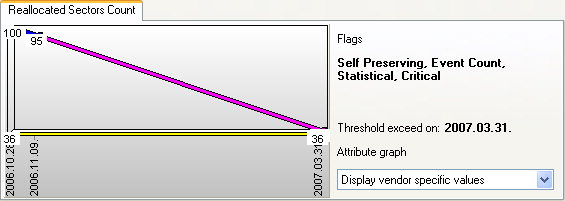
A dark blue line connects the real measured values. At the bottom of the graph, the threshold is displayed with a yellow line.
If the trend is decreasing, a purple line connects the last measured value with the threshold. This line is drawn based on the previous values (blue line). It indicates an estimated degradation of the hard disk in the future: if the attribute value will be decreased as before, the threshold exceed date (when the value will reach the threshold level) can be easily read.
For example (please see image above), it is possible to read that the hard disk is first examined on 28 Oct 2006. At that time, the value of the Reallocated sectors was 100. On 9 Nov 2006, this value is only 95 (because of many Reallocated sectors, the value changed from 100 to 95). If this trend will continue, this attribute will reach its threshold (36) on 31 Mar 2007 (it is displayed on the right side also so it is easier to read). It means on this date (or sooner) the hard disk must be replaced because of the increasing number of hard disk errors.
The differences between the two methods are described here.
Note for SCSI hard disks, the S.M.A.R.T. panel contains the statistical information provided by the SCSI hard disk (for example: total bytes read/written, number of read/write errors etc). The graph under the list can be used to examine the trend of any such attribute.
By default, the graph shows values measured at different dates when Hard Disk
Sentinel was active and could record actual status. The dates are automatically selected and
the graph is adjusted to show the attribute changes, trends.
Double click on the graph to display all possible
dates. To export all displayed values (in CSV format) with the appropriate dates when they
measured, right click on the graph and select the Save option.
Click between the S.M.A.R.T. table and the graph and drag the mouse to resize the panels.
Attributes on different devices
SCSI, SAS hard disks and SSDs, NVMe SSDs and other special devices (like industrial memory cards, tape drives) usually provide completely different set of attributes and in different format. There is no Value/Threshold/Worst fields (which present on IDE and Serial ATA devices), just attributes and their values. Hard Disk Sentinel identifies the status, the error counters and statistical information for these devices too.


 Introduction
 Hard disks, S.M.A.R.T.
 Installation
 Components of the application
 Status window
 Tray icon
 Disk icon
 Quick menu
 Main window
 Physical disk information
 Overview
 Temperature statistics
 S.M.A.R.T.
 Information
 Acoustic levels
 Log
Log Real time performance
 Alerts
 Logical drive
 Offline disks
 NAS disk monitoring
 Configuration
 Hard disk drives
 Preferences
 Status window
 Thresholds / tray icon
 Alerts
 Message settings
 E-mail configuration
 Registration
 Update
 Advanced options
 Disk control
 Hot keys
 Operations
 Projects
 Schedule
 Panic backup
 Transfer files
 Project settings
 Folder settings
 Global settings
 Project options
 Archiving files
 Integration
 Send report
 Hard disk tests
 General information
 Hardware self tests
 Random seek test
 Surface test
 Appendix
 Vendor specific vs raw values
 Health calculation
 Performance calculation
 Power on time, remaining lifetime
 Temperature calibration
 S.M.A.R.T. attributes
 Text description
